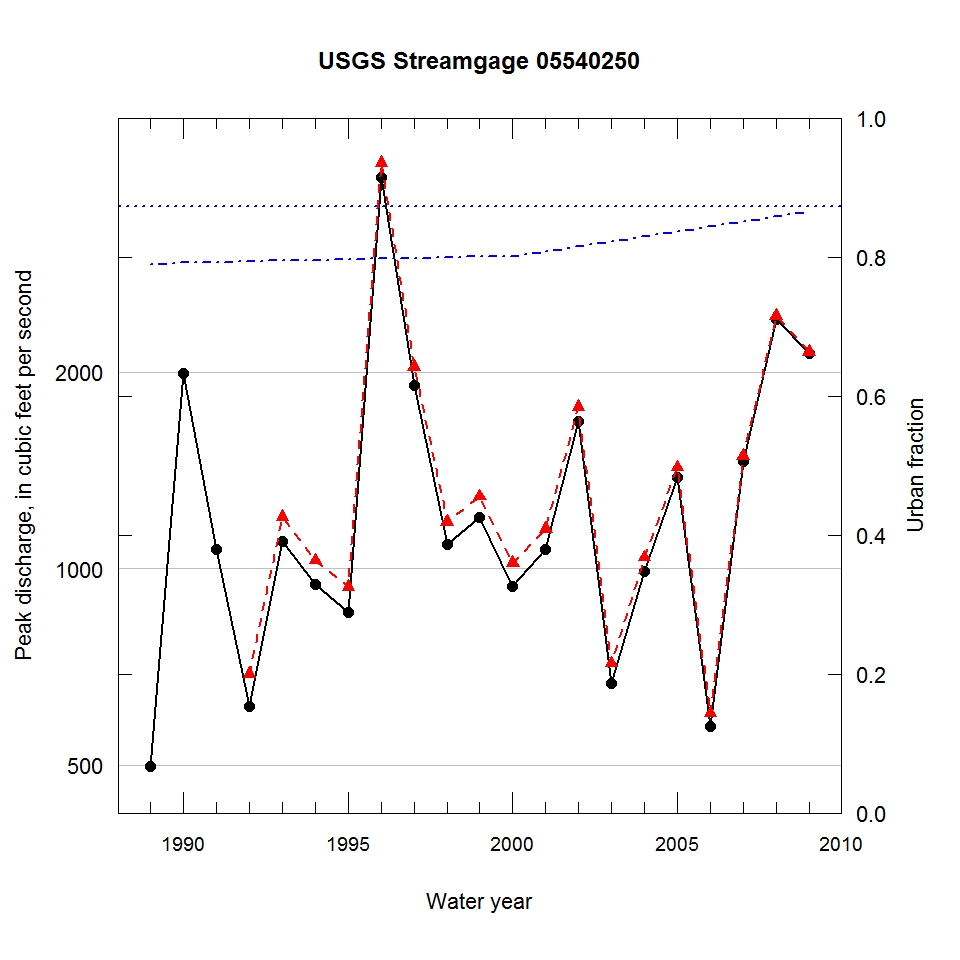
Observed and urbanization-adjusted annual maximum peak discharge and associated urban fraction and precipitation values at USGS streamgage:
05540250 EAST BRANCH DU PAGE RIVER AT BOLINGBROOK, IL


| Water year | Segment | Discharge code | Cumulative reservoir storage (acre-feet) | Urban fraction | Precipitation (inches) | Observed peak discharge (ft3/s) | Adjusted peak discharge (ft3/s) | Exceedance probability |
| 1989 | 0 | C | 420 | 0.789 | 1.633 | 497 | -- | -- |
| 1990 | 0 | C | 765 | 0.792 | 2.107 | 1990 | -- | -- |
| 1991 | 0 | C | 2181 | 0.793 | 1.563 | 1070 | -- | -- |
| 1992 | 1 | CD | 2181 | 0.793 | 1.598 | 615 | 689 | 0.845 |
| 1993 | 1 | C | 2181 | 0.794 | 1.816 | 1100 | 1200 | 0.371 |
| 1994 | 1 | C | 2181 | 0.795 | 0.804 | 945 | 1030 | 0.520 |
| 1995 | 1 | CD | 2181 | 0.796 | 1.283 | 858 | 938 | 0.607 |
| 1996 | 1 | C | 2181 | 0.797 | 6.008 | 3980 | 4190 | 0.005 |
| 1997 | 1 | C | 2181 | 0.798 | 2.617 | 1910 | 2040 | 0.059 |
| 1998 | 1 | C | 2181 | 0.799 | 1.282 | 1090 | 1180 | 0.387 |
| 1999 | 1 | C | 2200 | 0.800 | 0.762 | 1200 | 1290 | 0.286 |
| 2000 | 1 | C | 2200 | 0.801 | 1.294 | 938 | 1020 | 0.532 |
| 2001 | 1 | C | 2200 | 0.808 | 0.820 | 1070 | 1150 | 0.416 |
| 2002 | 1 | C | 2200 | 0.816 | 2.587 | 1680 | 1770 | 0.103 |
| 2003 | 1 | C | 2200 | 0.823 | 1.112 | 668 | 716 | 0.822 |
| 2004 | 1 | C | 2200 | 0.830 | 1.264 | 989 | 1040 | 0.514 |
| 2005 | 1 | C | 2200 | 0.837 | 1.453 | 1380 | 1430 | 0.208 |
| 2006 | 1 | C | 2200 | 0.844 | 2.359 | 573 | 600 | 0.913 |
| 2007 | 1 | C | 2200 | 0.851 | 3.077 | 1460 | 1490 | 0.186 |
| 2008 | 1 | C | 2200 | 0.859 | 3.015 | 2410 | 2440 | 0.032 |
| 2009 | 1 | C | 2200 | 0.866 | 1.114 | 2140 | 2150 | 0.047 |

